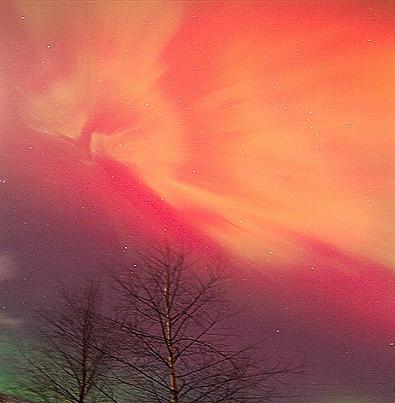
Jim Henderson took this picture on the 21st January near Aberdeen, Scotland [1]
Bright auroras spread across northern Europe on January 21st soon after a coronal mass ejection (CME) [from the sun] crashed into Earth´s magnetic field. The impact sparked a severe geomagnetic storm and, by many accounts, the best aurora-display in years. [2]

Source: http://sohowww.nascom.nasa.gov
This radiation storm hitting the earth was caused by explosions of the sun and was the strongest since October 1989. But its speed is what captured the attention of scientists. It is said that it approached the earth by about 1/3 of light speed.
On Jan. 11, 2005, it began to form as a smallish dot. By Jan. 15 it had swollen to about the size of Jupiter (something like 10 Earths across), a most impressive sunspot. Its rate of development was one of the most dramatic that we have witnessed with SOHO. [3] Astrologers say that Jupiter is the planet connected to Gold.
6000 years ago, the Egyptians were only using 1 symbol for 3 different things:
Gold, the Sun and the Eye.
Now having already talked about the recent activities of the Sun, let´s focus on Gold - maybe we can see with our own eyes if Gold is now ready for an eruption as well.
Since the X-MAS days of last year the U.S. Dollar is an upward movement from a low of 80.4 index points to a recent high of 84 points last Thursday. Gold fell in the same time from about $440 to $420. The correlation seems to be intact. The last trading days showed that the correlation is somewhat diminishing. In the 3 charts below one can see that in the last 5 trading days the Dollar was in a volatile upward trend, but that the Gold- and Silver-Price were moving sideways and managed to break out to the upside. Gold and Silver have unleashed the dominant influencing power of the Dollar by sticking to its support zones at $421 and $6.50 and breaking out to the upside even though the Dollar did not mark a new (5 days) low.


Since the beginning of the bearmarket of the Dollar in 2002, the Greenback has been the dominant price influencer on the price of Gold (POG). The Dollar fell from 120 to 84 index points (-30%). The POG rose in the same time from $260 to $420 (+62%). Thus, the goldprice rose more than twice as fast as the Dollar fell, which performance can be seen on the chart below:
Gold Relative to the Dollar:

The POG relative to the Dollar prefers moving in triangular chart patterns as can be seen above. The triangle with the black and green legs started its first wave at the end of 2002 as a thrust out of the grey triangle and was - like all the other triangles breaking out to the upside exactly after 4 waves. The price then pulled back to the upper leg and started to rise in a thrust - but the goldprice crash in the beginning of 2004 was causing this relative price to break below the green leg for the first time, which served as the dominant upward trendline as well. The consequence of this unsuccessful thrust to the upside should have been a sustainable crash to the downside, but the price started rising again to the point of intersection of the green and black lines. The price then was moving in the black and red triangle. At the end of the year 2004 the price was breaking the black and green resistance lines. This breakout was recently followed by a pullback to the apex. Having reached this point now, a thrust is about to occur. The question is, whether the price is now thrusting to the up- or downside.
To facilitate speculation, let´s throw an eye on the Goldprice itself. According to the next chart, the POG was moving in between the boundaries of the yellow triangle. In general there are ideally 4 waves in between the legs of a triangle before the impulse movement begins (wave 5), which shall break the upper leg (Breakout). Ideally this occurs about before the apex. Most of the times a price then corrects back to the upper leg to mark it as new support (Pullback). After that the price is supposed to thrust sustainable and explosively to the upside (to find out more about the characteristics of triangles, see my previous articles at FSO).
While marking a second high above $430 in the beginning of 2004, the POG surprisingly did not continue to thrust to the upside but crashed. Support was found at the lower leg. But instead of now thrusting to the downside (since the thrust to the upside was not successful), the POG was moving again in between the legs before breaking out another time at the end of 2004. This breakout was again marking the red resistance line before having started another Pullback to the upper leg this time touching exactly the apex of the triangle. Breakouts always mark a dominant resistance which needs to be broken with the help of the subsequent explosive thrust. To facilitate speculation if the POG now thrusts to the up- or downside, indicators may help. The RSI has reached the oversold area at 30 points and is now rising. The MACD as well found support and is poised to start rising again. Gold is now ready to start rising above previously marked $456 and taking the red resistance line as support. As soon as this has been undertaken, Gold shall rise sharply and strongly without looking back again.

Interestingly, the Dollar as well had been moving in between boundaries the last years, which apex as well had been reached recently. The overreactions (red 5, 6 and 7) out of the triangle were because the impulse movement after 4 waves were beginning, but were not strong enough to be sustainable. Therefore the Dollar went all the way to the apex from which ultimate point shall be decided if the Dollar now starts crashing for the first time, or starts booming to the upside.

To facilitate speculation if the Dollar is now rather thrusting to the up- or downside, let´s have a look at the Dollar relative to the price of Gold, which has been moving in a massive Head & Shoulder-Formation since the 1990s:

Recently, this relative price was crashing below the neckline. Even more recently, the price started rising again to this neckline, which is nothing unusual and called a classical Pullback to the neckline. After this has been undertaken, the implication of this specific formation is a sharp crash.
The Dollar itself recently showed how such a crash starts (from 90 to 80 points), because the Greenback was running in a Head & Shoulder-Formation as well, with the only difference of having a different neckline and therefore being faster. On the other hand, the next chart shows how long such a pullback to the neckline may last before the crash occurs:

According to the rules of Head & Shoulder-Formations, one can calculate a rough price aim: Take the distance from the head (120 points) to the neckline (94 points) and add it below the neckline. Therefore: 120 - 94 = 26. Price goal: 66 Points = 92 - 26.
The Euro-Index as well shows that the correction shall be over now or soon. The blue and black triangles were marking in the beginning of 2004 a resistance zone (red horizontal line), which needed to be taken as support with the help of an explosive thrust. At the end of 2004 the Euro finally thrusted above the 1.28 hurdle and broke out above 1.35. Since then we are witnessing a pullback to the former strong resistance zone to mark it as new strong support (saying Farewell a last time before advancing sustainably to the upside. The RSI, MACD and slow Stochastic are at a favourable level of which to start rising again.

The goldmining index XAU has been moving in an inverse Head & Shoulder-Formation, which broke out above the neckline from the middle until the end of 2003. The crash of the POG in the beginning of 2004 was forcing the XAU to undertake a classical pullback to the neckline. Since then the XAU is per definition in a boom phase and does not necessarily need another pullback to the neckline. The XAU has reached support at the red trendline and is only waiting for signs from the POG to continue its boom which will accelerate as soon as the previously high of 115 index points have been taken as support.

Goldmining shares are known to be leveraged to the movements of the POG. The over-performance of the XAU index versus the POG since the beginning of the bullmarket in Golds in 2001 can be seen with the following chart (in the years until 2001, goldmining shares were falling stronger than the POG did):
XAU Relative to the POG:

The above price of the XAU index relative to the POG since 2001 has been moving in between the boundaries of the green triangle. At the end of 2003 and 2004 the price was trying to break out, but not successfully. It is positive that the price thereafter did not break the lower leg and began crashing (only neglectable short overreactions). After now having found support again above the lower leg, the XAU is poised to outperform the POG again by rising to the upper leg, breaking it and start its first real boom.
The picture of the HUI index looks a bit different. The HUI preferred moving in 3 triangles, whereas the third one is almost twice as long as the second one (the second one was about twice the size of the first one). Each and every triangle since the new bullmarket started at the end of 2000 required 4 waves before breaking out, pulling back, and thrusting for about 100 points before the next consoldiation period in form of a triangle began.

The HUI relative to the POG as well preferred using triangular chart patterns, whereaes the month of April seems to be taken a cyclical dominance (breakouts and possible pullbacks were finished; the thrust begins in April):

The next chart compares the performance of the HUI versus the XAU, and emphasizes that an important point in the chart has been reached from where the HUI most probably will continue outperfoming the XAU (if the blue triangle thrusts to the upside).

As we presume that the Goldmarket is now ready for a big bang, let´s take a look at the price of Silver (POS), since it is widely known that they both are correlated positively to each other. Maybe the POS is bullish as well?

Indeed, the lunar-coloured metal has finished 4 waves in between the blue triangle and is already starting its impulse movement. The RSI indicator broke above the red resistance on Friday and is possibly showing us that the breakout will occur at the upper leg.
Now a good question is, if the sun- or the moon- coloured metal will be performing better. We anticipate that the POS will outperform the POG by large in the upcoming boom and years. The reasons were already found on the fundamental side the technical side may unfold soon as well, since the Silver-Gold-Price-Ratio is exactly at the apex of a year-long triangle. If the price is now thrusting to the upside, silver will outperform gold massively.

Now another good question is if the yellow or the black gold will be performing better in the upcoming years, as the Oilprice was moving in a triangle since 1999 (and is already thrusting to the upside!). We asked Mr. Ted Butler in an exclusive interview (which will be published at FinancialSense next Friday) what he would suggest. His answer shouldnt surprise...

The next 2 charts shall emphasize the quintessence of the above article: That the money markets are at the teeter of a knife´s edge!


The concluding 2 charts go out to highly respected Mr. Butler (who threw so much light on the depressed silver market that he most probably prevented the COMEX to change settlement rules auricularly) as he replied to the question in the upcoming interview, how it would be possible to recognize the date when the silverprice will decouple from currencies:
I don´t know how an analyst could tell in advance, unless he was a prophet, which I´m not. But there will come a time when the price action in silver will be so dramatic and independent of anything else, that it will be easily recognizable by all that silver is running by itself. The time is now:
POS & POG in Euro:

A bright moon gave some light to the landscape, and the clouds added drama: [4]


Footnotes:
(1) Jim Henderson took this picture on January 21st in northeastern Scotland, 25miles west of Aberdeen. His comment: Strong Aurora display of red and green, reaching half Corona with some interference from filling moon. Photos taken on Fuji S2, 1600ISO at 8-10secs, with Sigma 14mm f2.8.
Source: http://www.spaceweather.com/aurora/gallery_01jan05.htm
(2) Comment from the main page of www.spaceweather.com on January, 22nd 2005.
(3) Comment from the SOHO Breaking News section: article The Big Bang, January 21st, 2005; http://sohowww.nascom.nasa.gov
(4) Comment by Bjorn Jorgensen, who took this picture on January 18th in Ersfjord, Tromsoe, Norway.
Source: http://www.spaceweather.com/aurora/gallery_01jan05_page4.htm