"Much opinion brings conciliation" [1]
Triangular chart patterns reflect times of disagreement, indecision and nebulosity, in which neither the optimists nor the pessimists can take the reins into their hands and lead the market. Trading volume and volatility decrease in such a manner that prices settle down in a triangular form. The fashion how the market makers show themselves their fists is astonishing: Every price rise is perceived as a selling opportunity while every drop in prices is seen as a bargain, thereby forming highs and lows, which oftentimes run symmetrical to each other. The present sentiment in the gold-community is typical for triangular price formations: On the one side pessimism, skepticism and irresolution, and on the other founded optimism.
Triangles often adopt the characteristic of being volatile consolidation formations, in which a previous trend is questioned, halting and waiting for confirmation. Most frequently, triangles act as continuation patterns of the ongoing superior trend; but sometimes can initiate a trendchange, too. Whether a triangle breaks out to the up- or downside can not be said with a 100% guarantee. According to an empirical study by Thomas Bulkowski, one can be sure with a 95% probability, that an upside breaking triangle is being completed with an average rise in price of 37% (94% probability that a downside breaking triangle loses 15% on the average). [2]
In triangular times, a price moves within two tighter sloping legs, which compression forces the minds of the market to decide. In doing so, the steadily decreasing trading volume tends towards a status, in which supply and demand are counter-balancing themselves more and more until being equalized at approximately ¼ in front of the triangles` apex: The market has found an equilibrium price. Interestingly, this perfection is in most cases not lasting very long and the market discharges this compressed dissension in a spectacular way: The market forces are that apportioned and balancing the scale until one side starts to prevail and the other one to draw back (and as well jump on the departing train?): The price starts trending (again) fast.
Fake breakouts and pullbacks to the apex of the triangle are no uncommonness, because the gentlest "noise" in the market can shoot the price in a certain direction. Periods of discordance coupled with low trading volume occur as well in markets that (want to) implement a trendchange. This attribute makes a market vulnerable for interaction.
"In battles of opinions one shall be prudent the most, when the enemies are approaching and [want to] determine us." [3]
The longer the prior (downside) trend, the more withstanding is the skepticism about a enduring change in trend. Eventhough the goldmarket has been in an intact upswing since 1999, there appeared three periods in the last four years, in which the market opinions differed that much, that the goldprice had to build three protracted triangular price formations.
"Rivalry, defense and addiction for fame are the three major causes of the disunity of the people." [4]
"In the long-term, nothing and nobody is stronger than the market" [5]
The "long-term" began in the 9th month of 1999.

Phase 1: $275-Bottom
In the 8th month of 1999 the goldprice hit its rock bottom at $255 with the help of a fake breakout out of a triangle. In the 9th month it was announced through the "Washington Agreement" that 15 central banks were to stop their (many) gold sales. An event of magnitude with which it was successful to finalize the 20 year downside trend with a 21 month triangle. Right after the announcement the goldprice broke out and was meeting 50 Dollars later strong resistance ($325), bounced back to $300 and was taking care of $275 for the next 20 months.
The distribution of the price took the shape of a triangle, thereby forming new highs and lows, which were respectively lower. The tighter the legs became, the more the fluctuations of the price decreased. The apex of the triangle was pointing to the earlier marked bottom at $255. And at which time were the opinions more divided than during this period (if the goldprice has found a bottom or not)? With the help of this triangular chart pattern, the $275 price mark was found, marked, tested and confirmed as supporting bottom and at the same time signaled a crucial future resistance point: $325.
Phase 2: $325-Test
When the goldprice succeeded to break out of the (green) triangle to the upside, it forthon used (another) triangle for this. The apex of this 21 months triangle was pointing to the earlier marked resistance price at $325. The course of the goldprice showed new highs and lows that were consecutively higher than before. In the last 8 months before the breakout above $325, the dominant (pink) triangle used a smaller symmetrical triangle to overcome the resistance even more explosively and for the long haul (see chart below later). The breakout succeeded with a not less than 125% thrust[6], but (too) many were selling again as that the triangle would have taken the characteristic of a continuation formation right away. The price collapsed "to get the chance of saying farewell to $325 a last time", and it was not until this pullback was completed that the price of gold was thrusting to $400.
Phase 3: $400-Confirmation
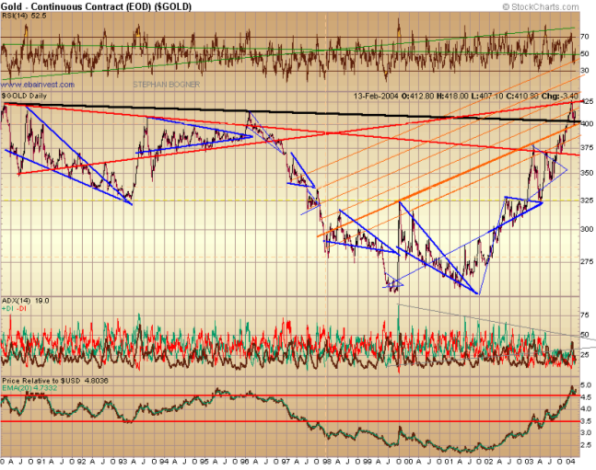
On its thrust to $400, the ambitiously higher climbing goldprice was being accompanied by an up-picking breeze of correction-thoughts, pessimism and lack of understanding, which sentiment is typical for triangles. After a "victory" (over Iraq) and a statistical (and therefore a seemingly) recovery of theU.S. economy, the opinions about the future price of gold were akin divided as they were in the period of the important trendchange decision at $325 from the middle of 2001 until the end of 2003. The sentiment in the gold community was that tensed in my humble opinion, because many gold-investors (and analysts) were confronted with the "problem" of HOLDING gold-(stock)positions that were yielding more than 100%. A situation, many were reminded to the 1990s tech-bubble, thinking to have learnt that such a stockprice development is not "healthy" and therefore "needs" a correction. I personally think that the gold-investors "needed" a reason to be able to sell their positions to finally(!) MAKE and TAKE the profits into their hands. My suggestion for a "healthy" gold(paper)market: Forget about transaction costs, trade frequently, trade not only senior miners but as well juniors and take profits consequently between 30% and 90%. If everybody was doing buy&hold strategy, then everybody will meet again in many "bubbles" not knowing what to do – being surrounded by greed, fear and irrational behavior. This can happen to any paper market!
After the first resistance at $325 could have been taken as support sustainable with the help of a 21 month triangle, the goldprice used another triangular formation for the next big resistance at $400, in which the prices were building up with steadily increasing new highs and lows. This time the apex of the triangle was pointing to $400 and the trespassing of the upper leg was accomplished about ¾ in front of the apex. Analog to the burst at $325, a significant breakout above $400 followed in the rest of the ¼ time and the thrust used a pullback from $430 to the apex at $400. In heavily traded markets, in which opinions and market forces differ considerably, a such "unsuccessful breakout" is no unusualness and in no way to be labeled negatively (except of may be the fact that the market has not really made up its mind – yet; differing market opinions = dangerous). In his book ""Encyclopedia of Chart Patterns", Thomas Bulkowski analyzed symmetrical triangles and came to the conclusion, that more than half of all his triangles used pullbacks to the apex before breaking out in a thrust.
Some results of his study: [7]
- Average rise after a breakout to the upside: 37%
- Average decline after breakout to the downside: 20%
- Average rise after a fake breakout: 20%
- Average decline after a fake breakout: 15%
- Average % that used a Pullback after a breakout to the upside: 58%
- Average % that used a Pullback after a breakout to the downside: 59%


Taking a closer look at the silverprice since 2002, one can find a massive triangular price formation. In July 2003 silver was crossing the upper leg for the first time. Simultaneous, gold was still in wave 2 of 5 within its own triangle and was rising from $350 to $380. As gold fell from the upper leg to the lower one in October, this was forcing the silverprice to pull back in the direction of its apex. The goldprice then tested both legs a last time before a price fixing above the legs was possible: Gold was trading for $395 and silver for $5.45 an ounce. The break above $400 succeeded and gold rose more than 25 Dollars in 4 weeks. Thus, the starting signal for the fulminant $1-silverprice "explosion" came from the goldprice. Because gold was again pulling back to its apex, silver was quivering that much between $6.60 and $6.20.
The following charts of the HUI- & XAU-indexes are to demonstrate that the ongoing disagreement about the price of gold shall as well find an end in the paper-gold market soon.

The HUI-Index trespassed a significant resistance line (red) as early as October 2003. This was managed with the help of the explosive power of a 12 months strong triangle. Interesting that this triangle as well had to use a pullback to its apex to be able to thrust after that. At the moment, this new support is being tested with another triangle.

Bema is trading above a former strong resistance line, which price level was achieved with a 15 months triangle.

Coeur D`Alene is still thrusting out of a similar big triangle. At the moment the price holds above a strong support line. Next stop in the case of a rising goldprice: $7.50 and $10.

Golden Star is struggling with its (pink) line. If this line shall function as support or resistance in the future is not yet decided and is being tested by a triangle. Should the $5 price mark hold and the triangle breaks to the upside, a price increase of 100% would not be a hyperbole. Should the triangle break to the downside one should consider a potential loss of at least 50%, because next support might appear at $2.50. Similar risk-reward-ratio throughout the entire goldmarket!

Hecla has already left its upper triangular leg. This could indicate a possible breakout to the upside above the $10 price mark in the direction of the ("last") resistance line (red) soon. If having reached this red line, one should take into consideration that Hecla might pull back from this level to the apex of its triangleÂ…

IAMGold is trying to trade above its upper triangular leg.

The development of Randgold is quite interesting, since the price fell under the lower leg since the beginning of the year and is drifting sideways. In doing so, the price of Randgold is moving within the boundaries of a triangle, which formation should supply a decision soon, if Randgold shall fall down to $15 or if this is would be a golden buying recommendation at the moment.

The XAU-Index managed to leave its downside trend with the help of a head and shoulder formation by trading above the neckline at the end of 2003. A classic pullback to the neckline was holding and giving a buy-signal.

Agnico as well used a yearlong head and shoulder formation, whose shoulders were formed in the shape of massive triangles. The first blue triangle shows impressively how a fake breakout can look like.

Anglogold has been captured in a triangle since the end of 2001 and tried to break out two years later.

Charttechnically speaking, the performance of Barrick was that lousy since 1996, because it was forced to move in the direction of its triangular apex, which was pointing downside to $23. Since more than 6 months now, Barrickmanaged to overcome this powerful force by crossing the upper leg. The breakout pulled back to its apex and could not trade above $30 yet. This might be because Barrick is waiting for a signal from gold.

Durban made it to jump out of its 2 year long triangle.

In contrast to Barrick, the "former" extensive Hedger Freeport McMorgan was pushed out of its 8 year long triangle and landed sky-high above former strong resistance at $30. If this price mark shall hold for the long-term is being decided by a triangle.

Analog to the shares of Randgold, Goldcorp is drifting out of its steep sloping (green) triangle, which actually is a thrust out of the 5 year (blue) triangle. Maybe Goldcorp is forming a "decision-triangle" right now similar to whatRandgold has been doing in the last weeks.

Gold Fields is trading at a 1990s price level similar to the one gold is at. Contrary to physical gold, Gold Fieldshas been building up a big symmetrical triangle since 2002.

The chart from Harmony seems to be quite robust. Have a closer look at the comparison of each gold-stock with the price of gold (underneath every stock-chart "Price relative to Gold"): Triangles everywhere! Should a triangle like this one break to the upside, this would indicate that the gold-stock is (again) rising faster than gold.

After breaking out of its triangular legs, Kinross is trading at the apex of a 2 year triangle and the pullback is analogical to gold completed.

Meridian was breaking out of a 1 year triangle to the downside 1 year ago. It took Meridian 1 year to come back to old $15. Maybe this will (soon) serve as an example of a fake breakout.

Newmont has reached a price level ($40), which in the 1990s was acting as strong support. This supporting price level was achieved with a triangle that was formed in 2002 and completing with a 100% thrust to the upside. If Newmont will be trading under or above this price level in the next future, will be decided by a triangle.

Placer Dome shows impressively, that a gold-stock can rise fast more than 100% without the help of a triangular price formation. Or am I missing something?